INTERACTIVE DISPLAY OF LUV DATA
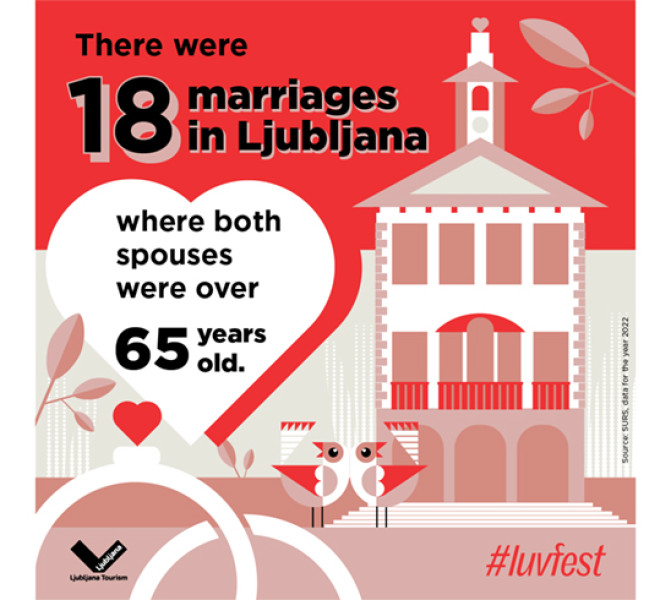
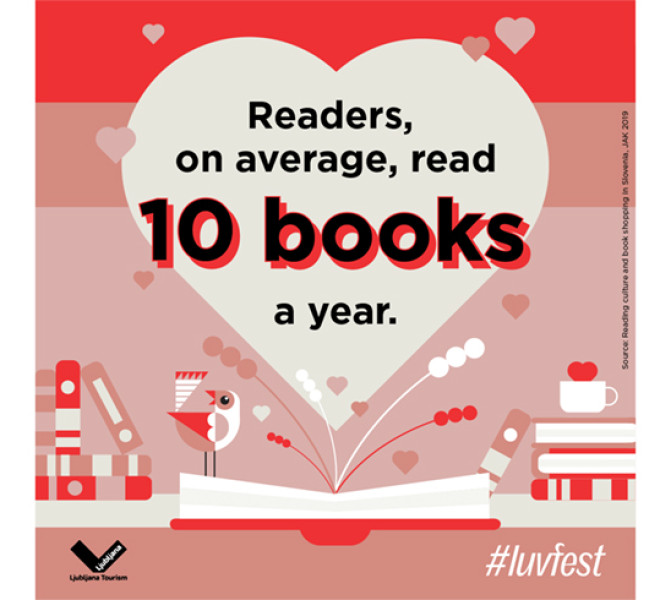
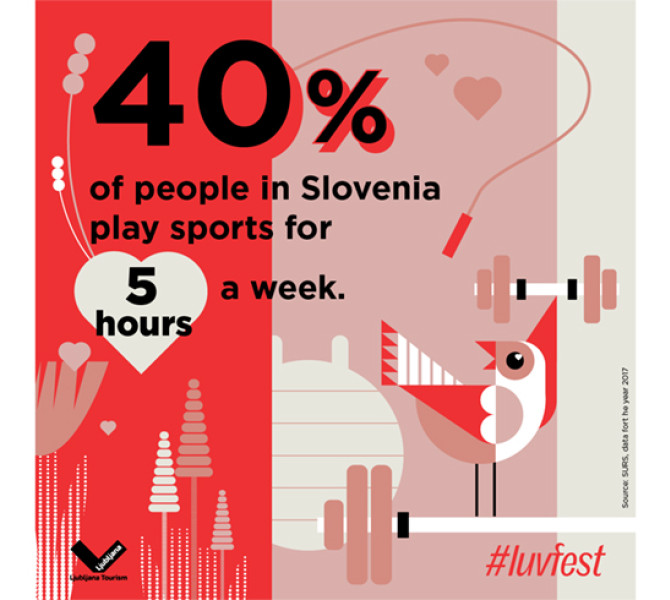
We want to present the data to the interested public in a more engaging and interactive way. An example of such data presentation is data visuals, which we are preparing as part of the LUV Festival. These data visuals, featuring selected interesting data, are published on social media, where we invite users to participate through quiz questions.
-

© Rubikon Gral
-

© Rubikon Gral
-

© Rubikon Gral
-

© Rubikon Gral
